
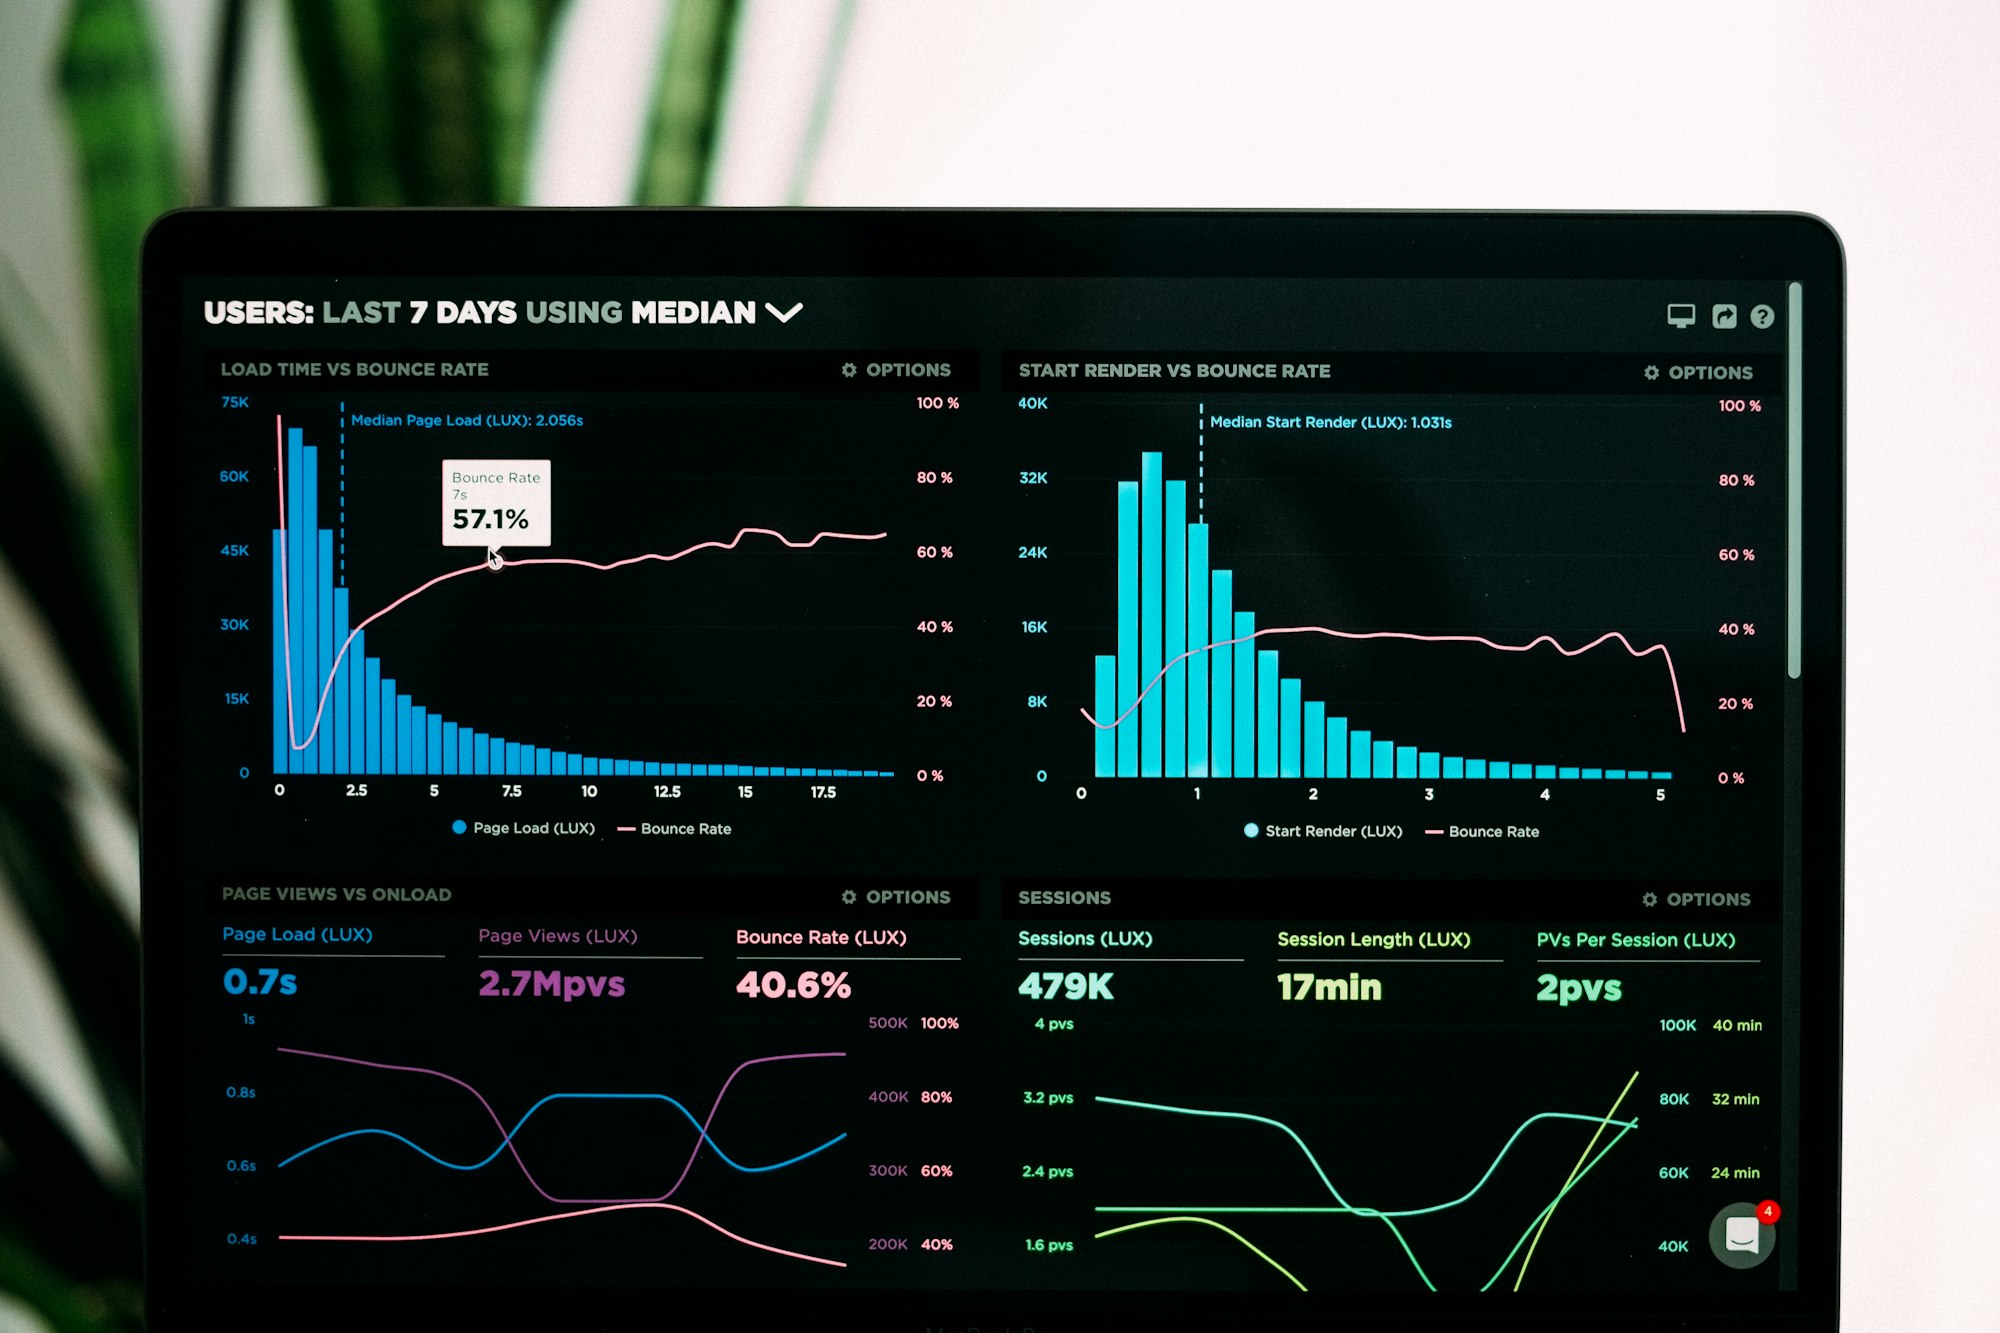
Database visualization panels are powerful tools that allow users to visually explore and analyze data stored in databases. These panels provide an intuitive interface to interact with database data and present it in a visually appealing and easy-to-understand manner.
Features
- Data exploration: Database visualization panels enable users to explore large datasets, perform ad-hoc queries, and apply filters to uncover insights and patterns.
- Interactive visualizations: Users can create interactive charts, graphs, and dashboards to visualize database data. These visualizations can be customized and updated in real-time as the underlying data changes.
- Data aggregation and summarization: Database visualization panels offer various aggregation and summarization functions to summarize and present data in a concise and meaningful way. Users can generate reports, summaries, and key performance indicators (KPIs) based on the database data.
Benefits
- Improved data understanding: Database visualization panels help users gain a deeper understanding of their data by providing visual representations of complex database structures and relationships. This makes it easier to identify trends, anomalies, and correlations.
- Efficient decision-making: With database visualization panels, users can quickly analyze and interpret data, leading to more informed decision-making. Visualizing data in real-time allows for timely insights and enables users to take action based on up-to-date information.
- Enhanced collaboration: Database visualization panels facilitate collaboration by allowing users to share visualizations, reports, and dashboards with team members. This promotes knowledge sharing and fosters a data-driven culture within organizations.
Business Intelligence (BI) Integration
Database visualization panels often integrate with business intelligence (BI) tools, providing seamless connectivity to databases and enabling advanced analytics capabilities. BI integration allows users to leverage additional features such as advanced data modeling, predictive analytics, and data storytelling.
Use Cases
- Data analysis and reporting: Database visualization panels are widely used for data analysis and reporting purposes. They enable users to perform complex queries, visualize data trends, and generate reports for various business needs.
- Performance monitoring: Database visualization panels can be used to monitor the performance of databases and identify bottlenecks or areas for optimization. Real-time visualizations of database metrics help ensure efficient database operations.
- Data-driven decision-making: Database visualization panels empower users to make data-driven decisions across various industries, such as finance, marketing, healthcare, and e-commerce. Visualizing key metrics and performance indicators supports strategic planning and informed decision-making.
Overall, database visualization panels provide a user-friendly and efficient way to interact with databases, explore data, and derive meaningful insights. They play a crucial role in leveraging the power of data for better decision-making and driving business success.
1- Decile
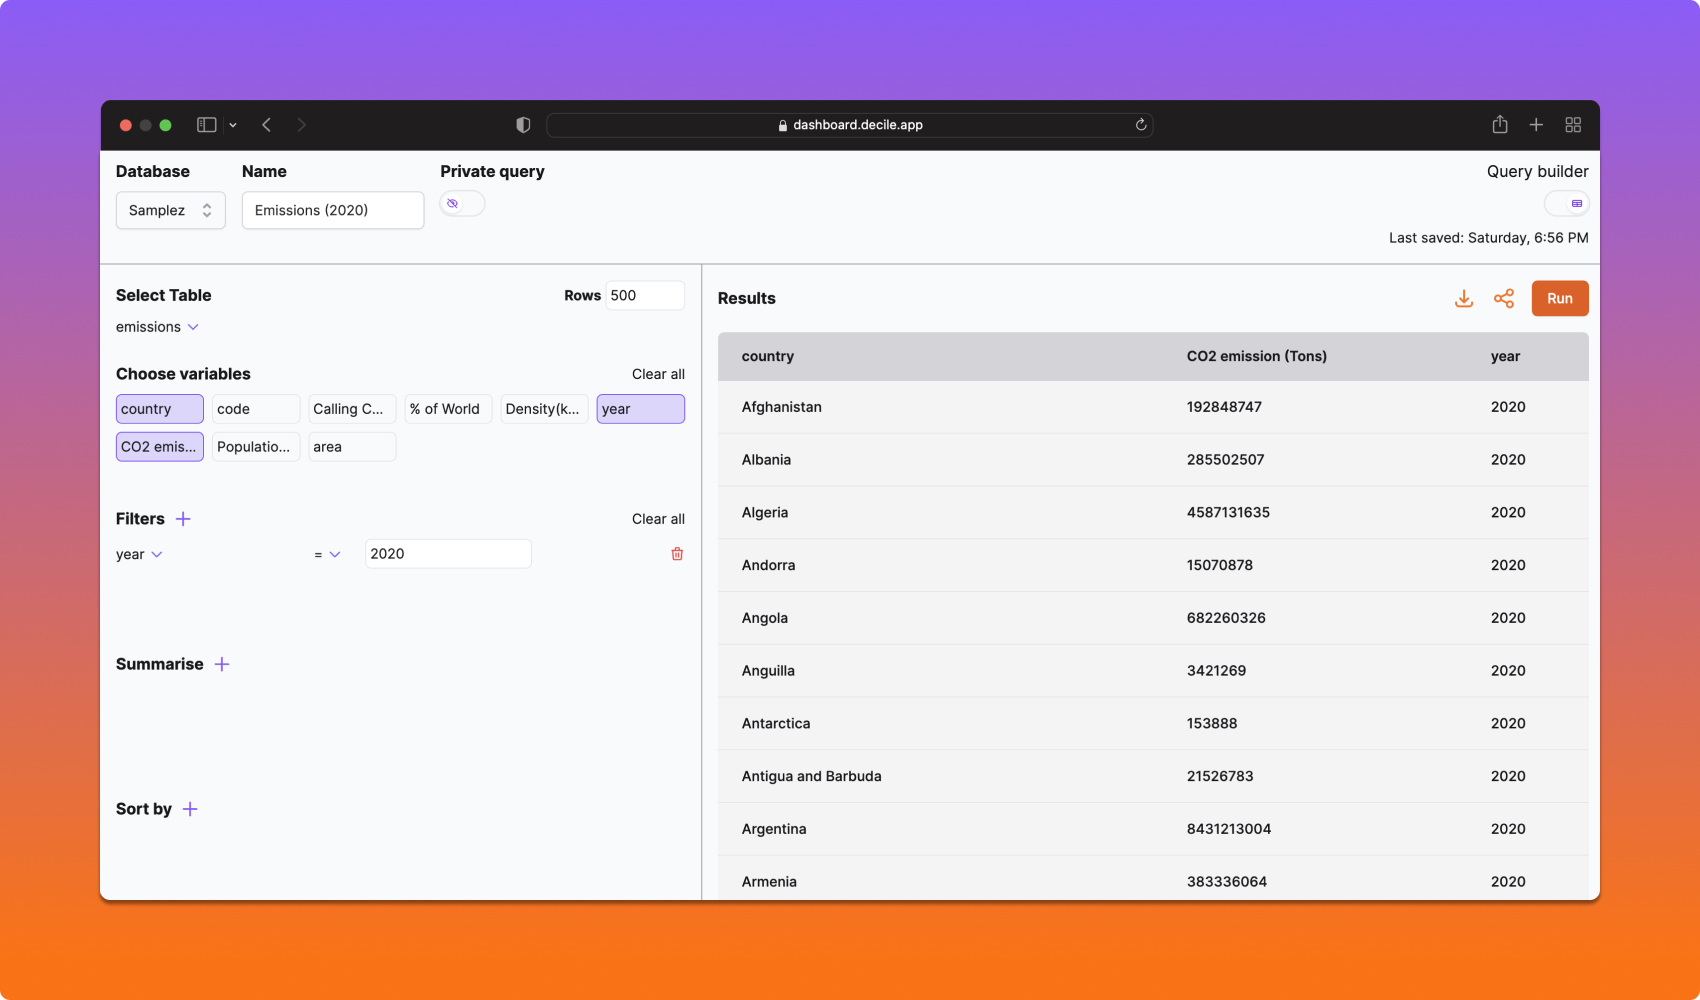
Decile is a powerful and user-friendly open-source analytical tool that enables you to perform advanced analytics on any Postgres database. With Decile, you can easily connect to any Postgres database and leverage its full potential. Not only can you save and share queries with your team, but you can also export the results to Google Sheets for further analysis and collaboration.
Additionally, Decile allows you to schedule queries, ensuring that your Google Sheet is automatically updated with the most up-to-date data. Experience the convenience and efficiency of Decile for all your analytical needs.
Features
- Authentication UIs including sign in and sign up
- Google sign in
- Invite your team to share queries
- Admin and user roles
- Add any Postgres database
- Online SQL Edior
- Query without SQL
- Export to Google Sheets
- Schedule queries by hour, day, week or month
- Email notifications
- Line and bar graphs
 decileapp
2- Abixen Platform
Abixen Platform is a microservices-based software platform for building enterprise applications. It allows the creation of functionalities through the implementation of separate microservices and integration using the provided CMS.
The platform also offers a Business Intelligence Service for creating reporting charts and tables, and a Web Content Service for creating articles using simple forms or advanced structures and templates.
How does it work?
Business Intelligence Service is one of the delivered functional modules.
This module allows to do reporting charts and tables. A business administrator can create the charts and feed it by a following flow:
- Create a database connection to one of supported databases (H2, MySQL, PostgreSQL, Oracle, MSSQL). Instead of database connection, there is an opportunity to use an excel or CSV file
- Create a data source using above database connection or file.
- Add a new business intelligence instance on a page
- Configure a chart series selecting a data source
- Set permissions for particular users' roles
abixen3- Hue
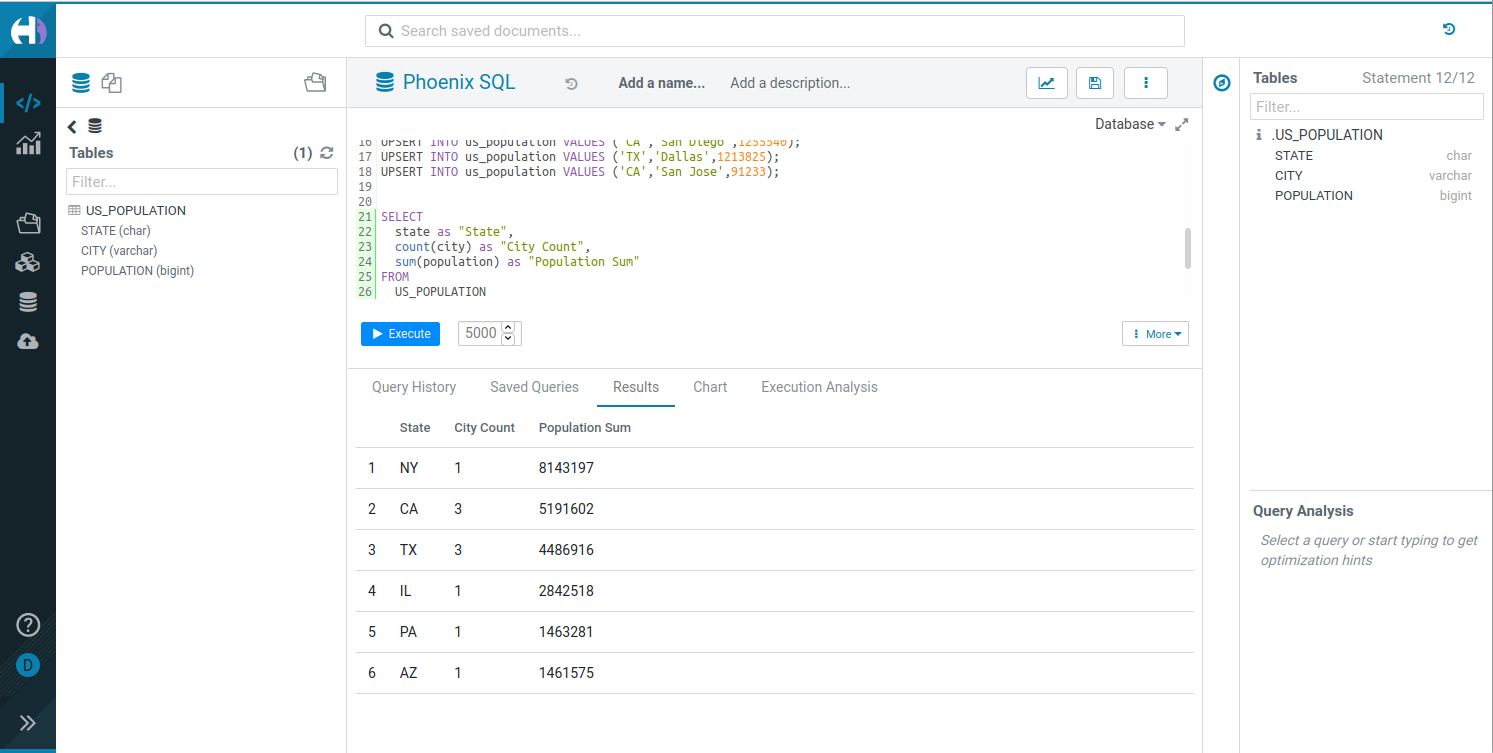
Hue is a mature SQL Assistant that allows users to query databases and data warehouses. It offers self-service querying and supports a high volume of daily queries. Users can connect to databases, build their own SQL editor, and query through the UI or API.
cloudera4- Rill
Rill is the fastest path from data lake to dashboard. Download Rill to start modeling data and create fast, exploratory dashboards.
Rill's database visualization panels prioritize a user-friendly experience with fast performance, support for local and remote datasets, automatic profiling for intuitive understanding, real-time dataset re-profiling, simple interactive dashboards for quick insights, and code-based dashboards with versioning and sharing capabilities.
rilldata5- Slashbase
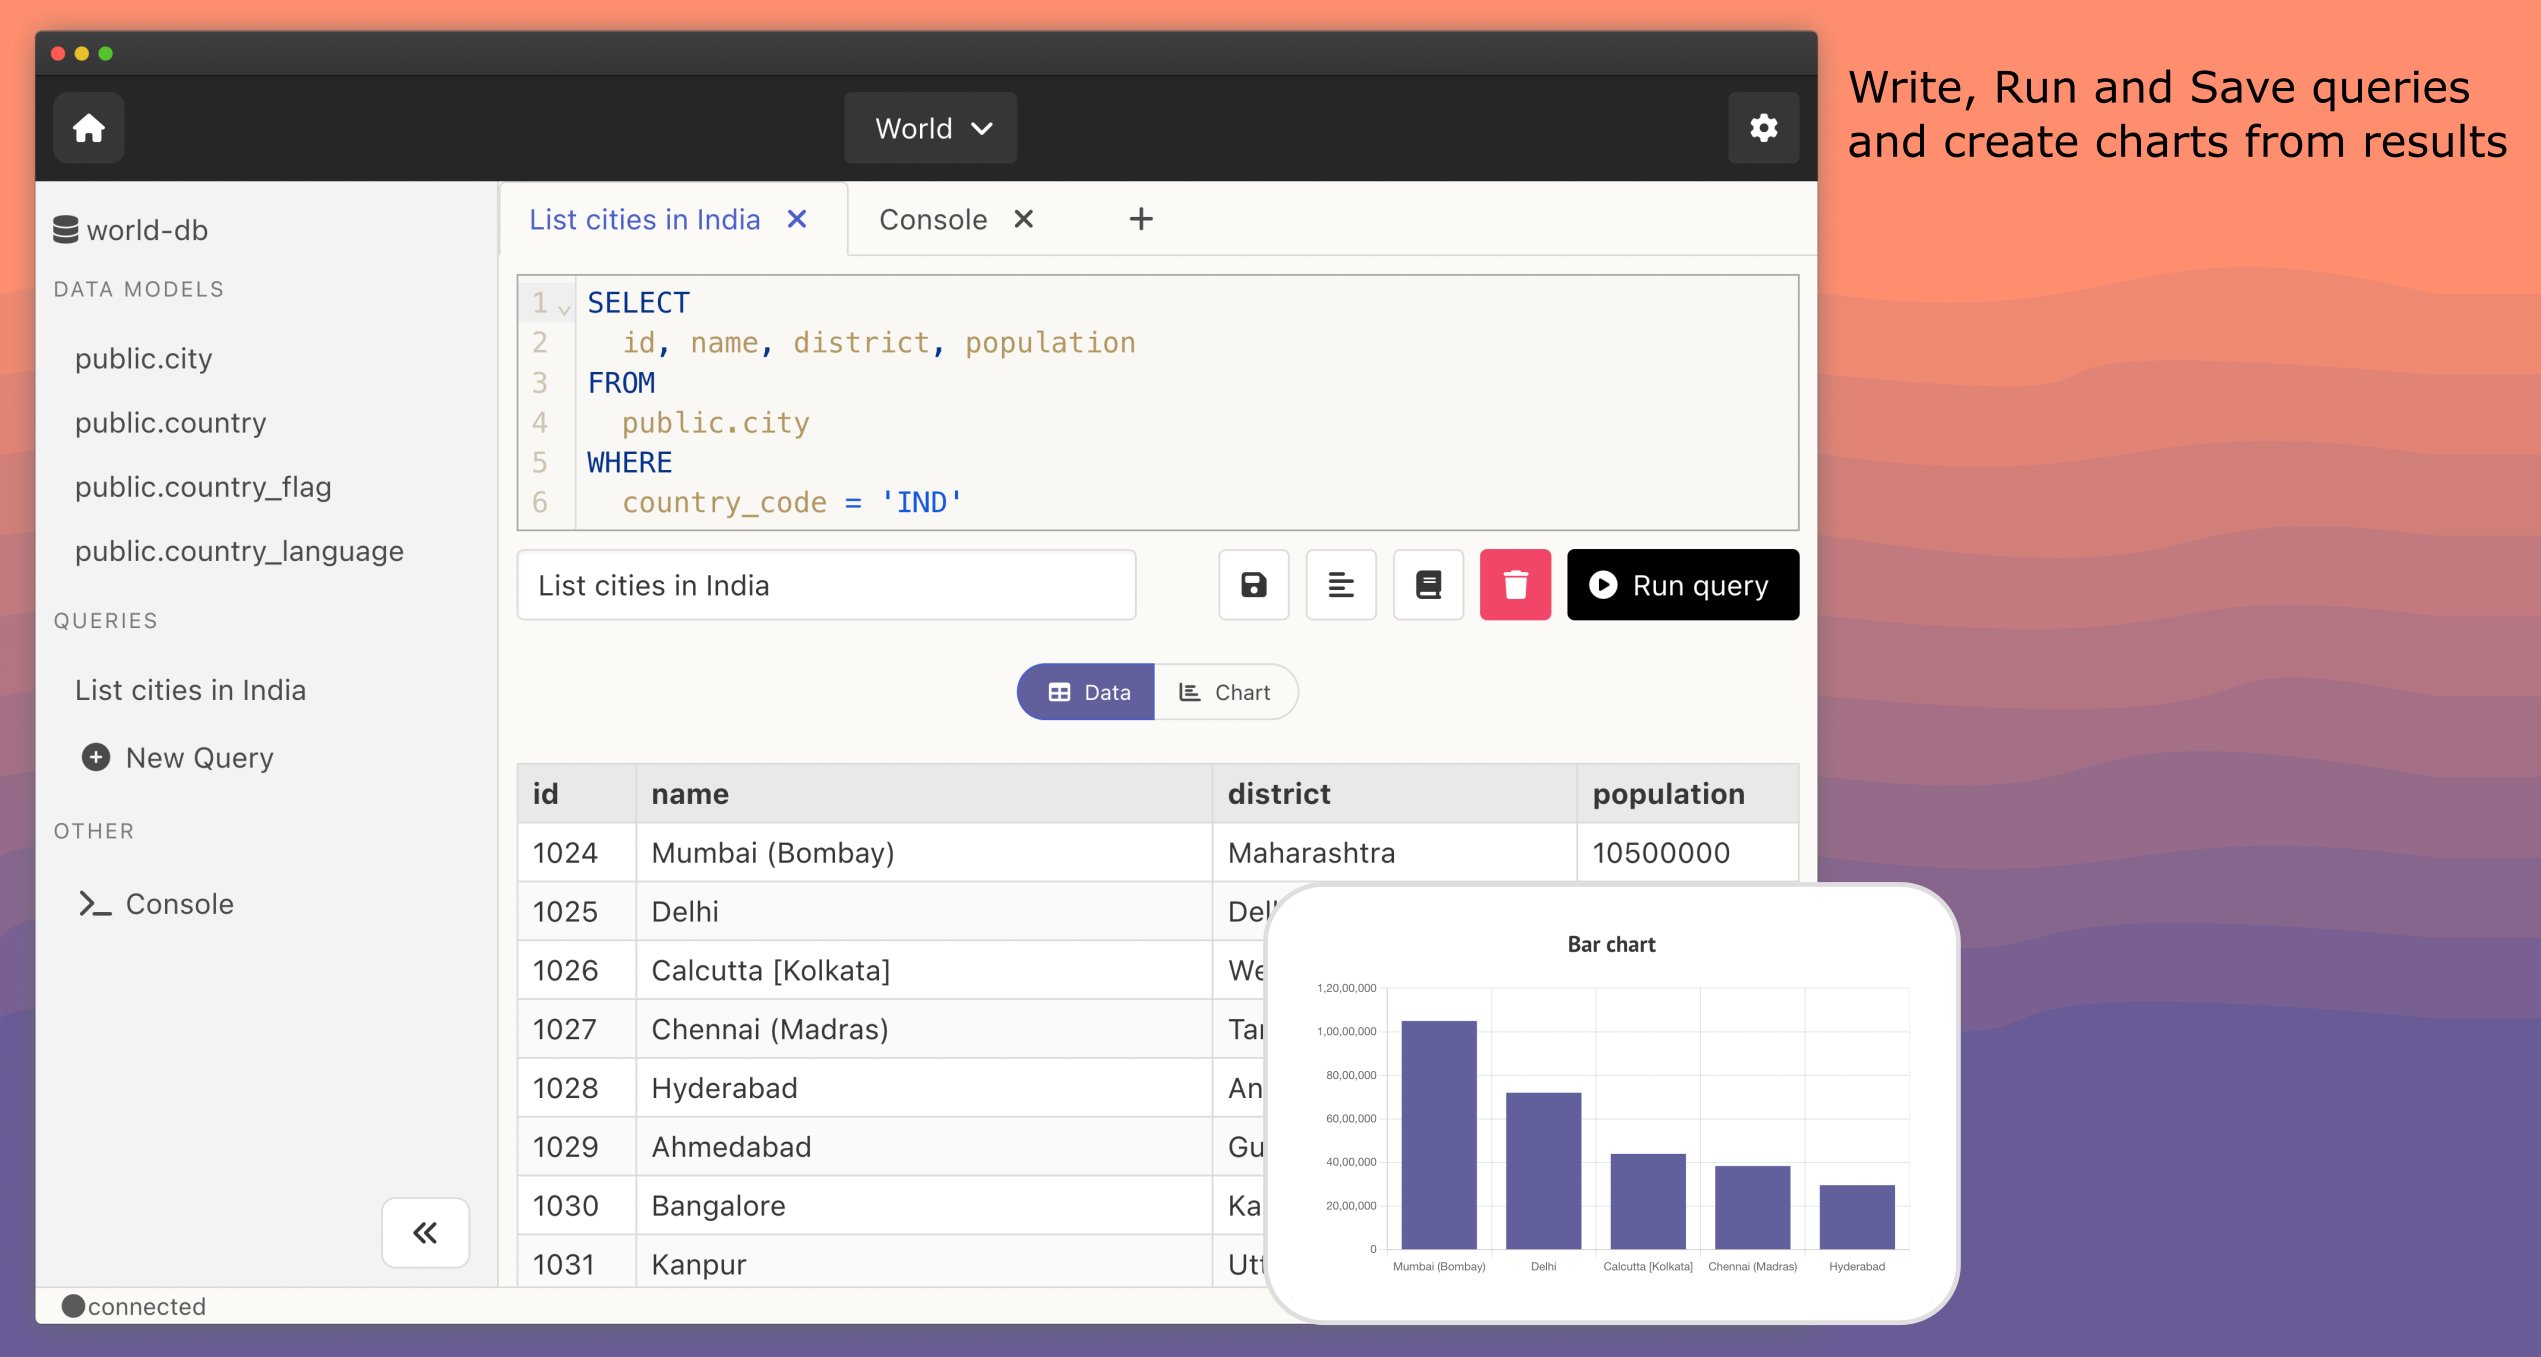
Slashbase is a powerful open-source modern database IDE designed for your dev/data workflows. Utilize Slashbase to effortlessly connect to any of your databases, seamlessly browse data and schema, effortlessly write, execute, and save queries, and effortlessly create visually appealing charts. Slashbase supports a wide range of databases including MySQL, PostgreSQL, and MongoDB.
Features
- 🧑💻 Desktop and Server App: Use the IDE as a standalone desktop app or self-host on your server.
- 🪄 Modern Interface: With a modern interface, it is easy to use.
- 🪶 Lightweight: Doesn't take much space on your system.
- ⚡️ Quick Browse: Quickly filter, sort & browse data and schema with a low-code UI.
- 💾 Save Queries: Write and Save queries to re-run in the future.
- 📊 Create Charts: Create charts from your query results.
- 📺 Console: Run commands like you do in the terminal.
- 🗂 Projects: Organise all database connections into various projects.
- 📕 Query Cheatsheets: Search and view query commands syntax right inside the IDE.
- ✨ Generate SQL with GPT: Write prompt to generate SQL using GPT and run it.
- ✅ Database Support: MySQL, PostgreSQL and MongoDB.
slashbaseide6- Datart
Datart is a next generation Data Visualization Open Platform.
running-elephant7- Poli
Poli is an open-source BI server designed for SQL enthusiasts, offering self-hosted setup, support for various databases, SQL editor and schema viewer, rich and flexible styling, interactive adhoc reports, canned reports, user management, internationalization, and released under the MIT license.
Features
shzlw8- DataStation
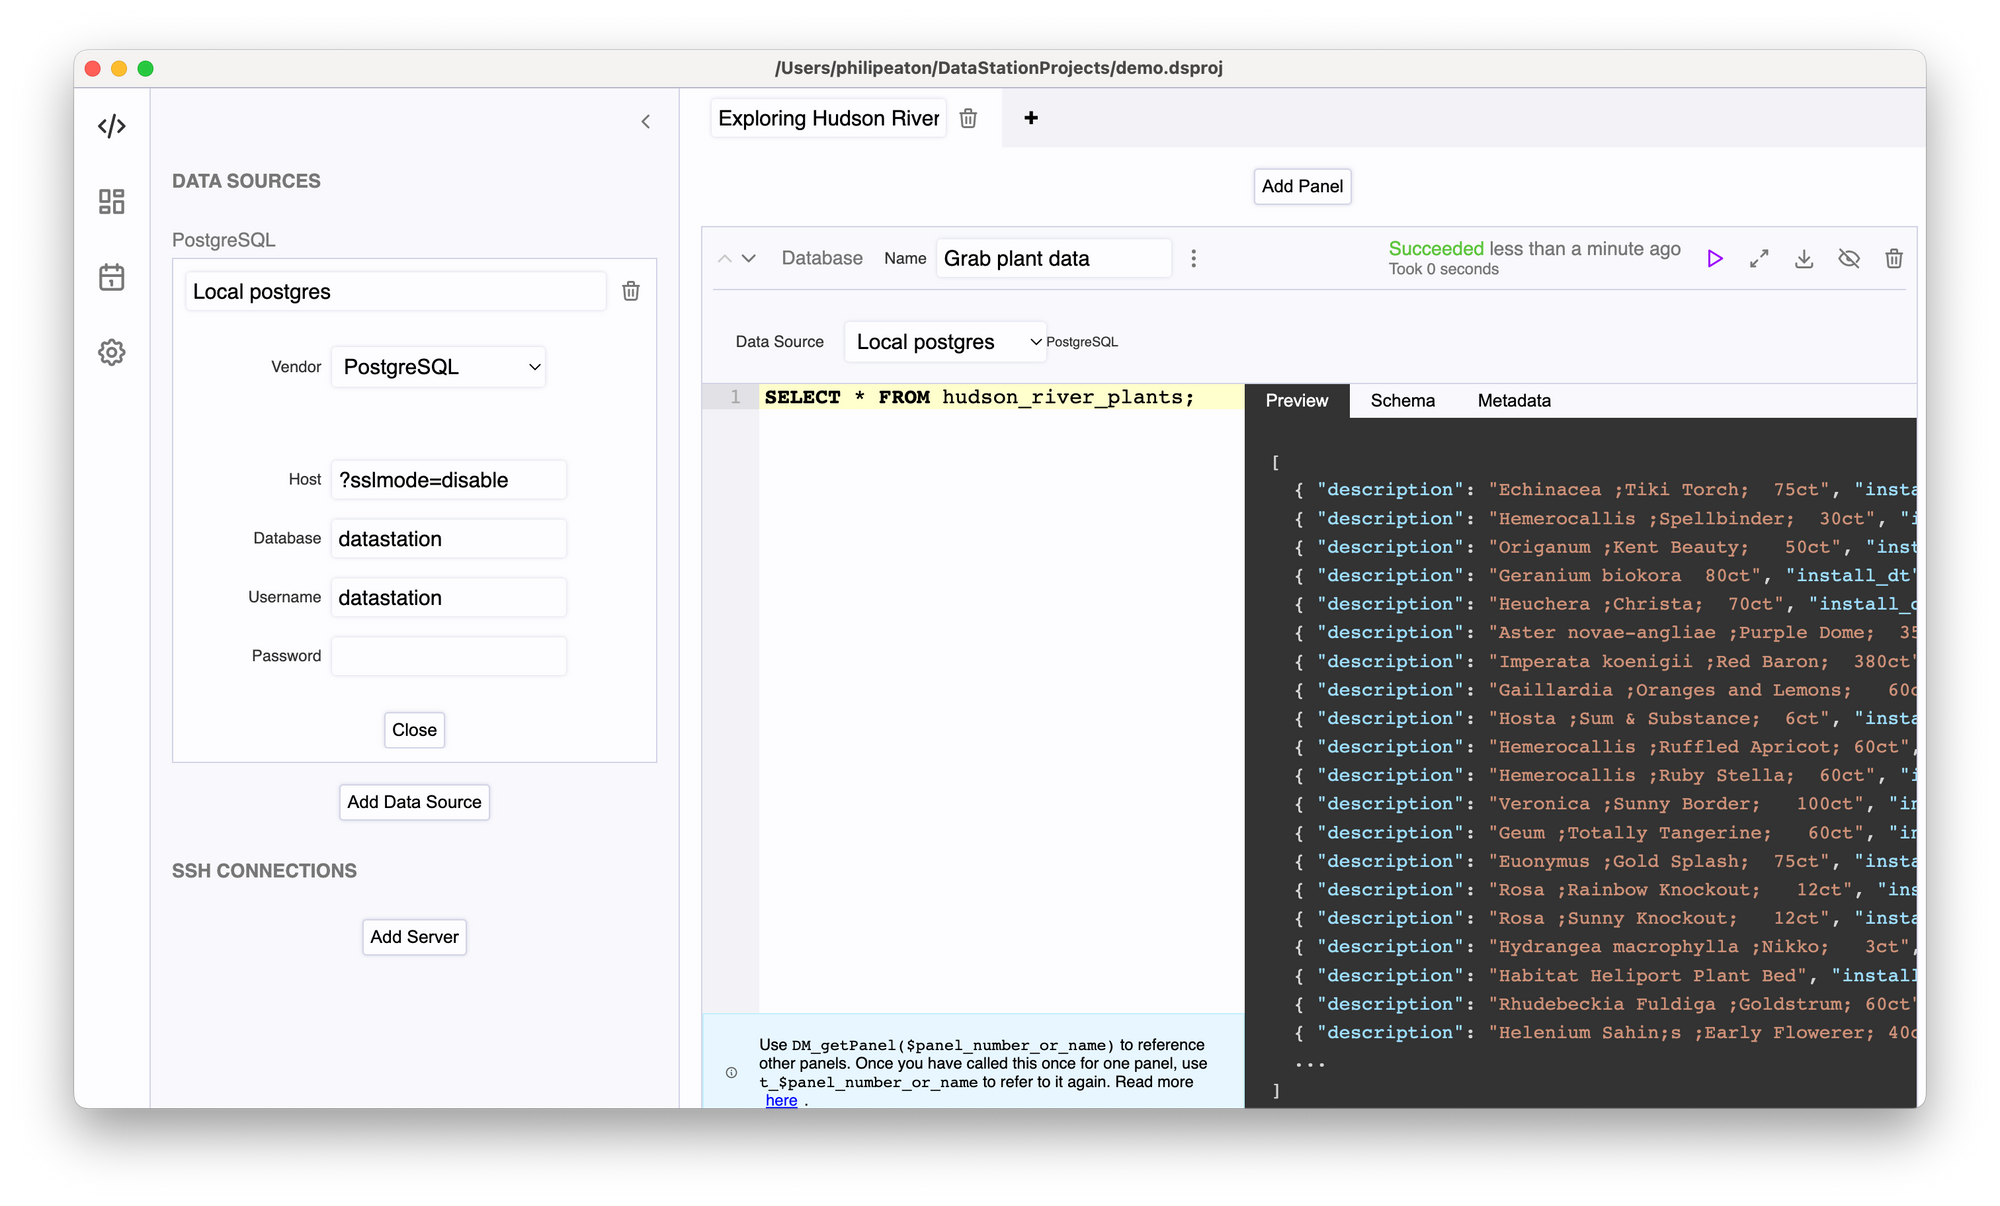
DataStation is an open-source data IDE for developers. It allows you to easily build graphs and tables with data pulled from SQL databases, logging databases, metrics databases, HTTP servers, and all kinds of text and binary files. Need to join or munge data? Write embedded scripts as needed in languages like Python, JavaScript, R or SQL. All in one application.
Features
- Build reports with graphs, charts and tables
- Script against data
- Cross-platform: Windows, macOS, and Linux
- Easily fetch your data, wherever it is: 18 SQL and non-SQL databases, files, HTTP servers
Supported data sources
Over 20 supported databases out of the box including: PostgreSQL, MySQL, MariaDB, SQLite, SQL Server, Oracle, ClickHouse, Influx 1 (InfluxQL), Influx 2 (Flux), Prometheus, Elasticsearch, AWS Athena, Google BigQuery, Snowflake, Cassandra, Scylla, TimescaleDB, YugabyteDB, CockroachDB, CrateDB, QuestDB, and Airtable.
Supported data formats
Over 13 supported file formats including: Avro, Parquet, JSON, JSON Newline, Concatenated JSON, CSV, TSV, Excel (XLSX), ODS, Apache Error Logs, Apache Access Logs, Nginx Access Logs, and Newline-delimited Custom Regexp.
multiprocessio9- Metabase

Metabase is a powerful and user-friendly open-source tool that enables every member of your company to effortlessly ask questions and gain insights from data.
Key features of Metabase include:
- Easy setup: Get started in just five minutes by following the simple instructions provided here.
- Simplified data querying: Even without knowledge of SQL, anyone on your team can easily ask questions and extract valuable information using Metabase. Say goodbye to complex coding!
- Advanced SQL editor: For more complex queries, you can leverage the SQL editor in Metabase to perform advanced data analysis and obtain deeper insights.
- Interactive dashboards: Create visually appealing and highly interactive dashboards with Metabase. Customize filters, enable auto-refresh, view in fullscreen mode, and define custom click behavior to enhance the user experience.
- Enhanced data modeling: Metabase allows you to create models that clean up, annotate, and combine raw tables, making your data more organized and easier to analyze.
- Standardized metrics and segments: Define canonical segments and metrics in Metabase to ensure consistency and enable your team to work with standardized data.
- Automated data delivery: Schedule data delivery to Slack or via email using Metabase's dashboard subscriptions feature. Stay updated with the latest insights without any manual effort.
- Real-time alerts: Set up alerts in Metabase to receive notifications whenever there are changes in your data. Stay informed and take immediate action when necessary.
- Seamless embedding: Embed charts and dashboards from Metabase into your own applications or even embed the entire Metabase platform. Share insights with your users without any hassle.
Discover the power of Metabase and unlock the true potential of your data-driven decision-making process. Start exploring today!
 Hmza Abbas
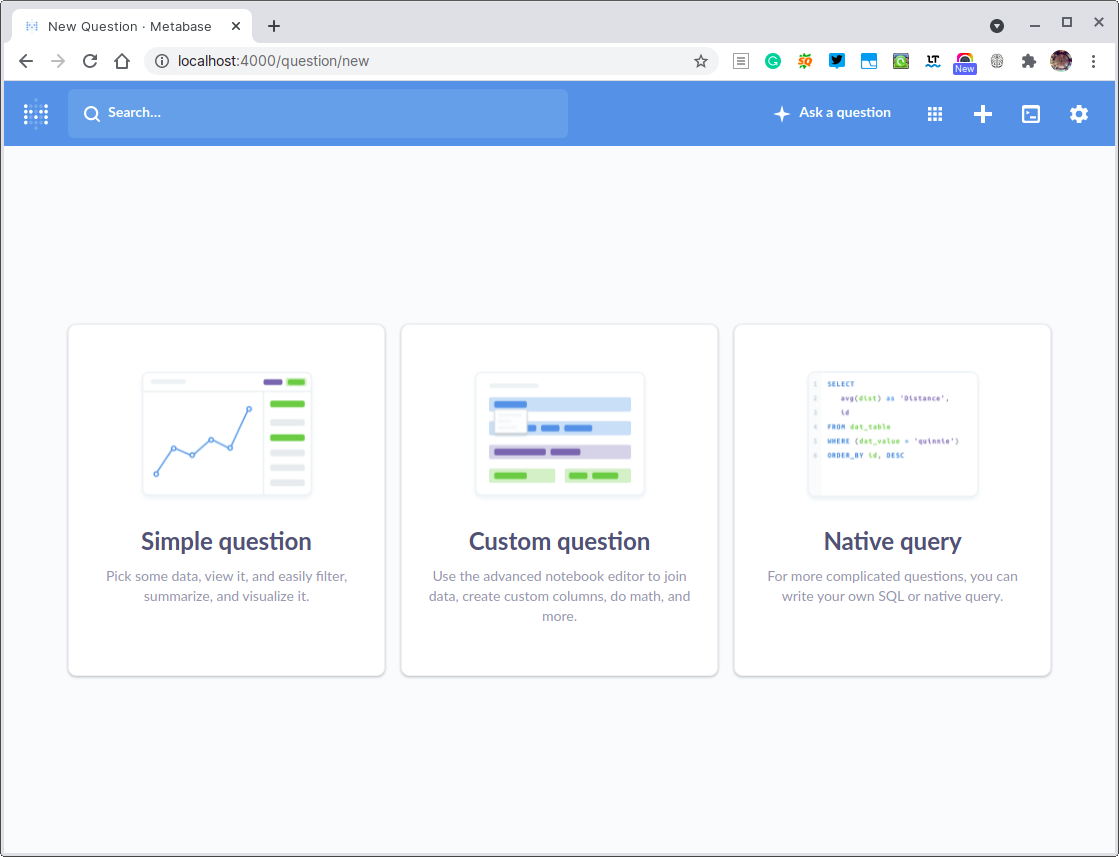 metabase
10- Apache Superset
Superset is a modern data exploration and data visualization platform that offers a wide range of features and benefits. With Superset, teams can enhance their data analysis and reporting capabilities while reducing dependency on proprietary business intelligence tools. Superset seamlessly integrates with various data sources, making it a versatile solution for different data environments.
Key features of Superset include:
- A user-friendly and intuitive no-code interface that allows users to quickly build charts and visualizations without the need for coding knowledge.
- An advanced and robust SQL Editor that empowers users to perform complex queries and data manipulations.
- A lightweight semantic layer that enables users to define custom dimensions and metrics effortlessly, providing flexibility in data analysis.
- Out-of-the-box support for almost any SQL database or data engine, ensuring compatibility with existing data infrastructures.
- A wide array of stunning visualizations to effectively present and communicate data insights, ranging from simple bar charts to geospatial visualizations.
- A configurable caching layer that optimizes database performance and helps mitigate the impact of heavy database loads.
- Highly extensible security roles and authentication options, allowing organizations to customize access controls and ensure data privacy.
- An API that enables programmatic customization and integration with other systems or applications.
- A cloud-native architecture that is designed from the ground up for scalability, ensuring that Superset can handle large volumes of data and growing user demands.
In summary, Superset is a powerful and versatile data exploration and visualization platform that empowers teams to unlock the full potential of their data while providing a user-friendly and seamless experience.
apache11- Urungi
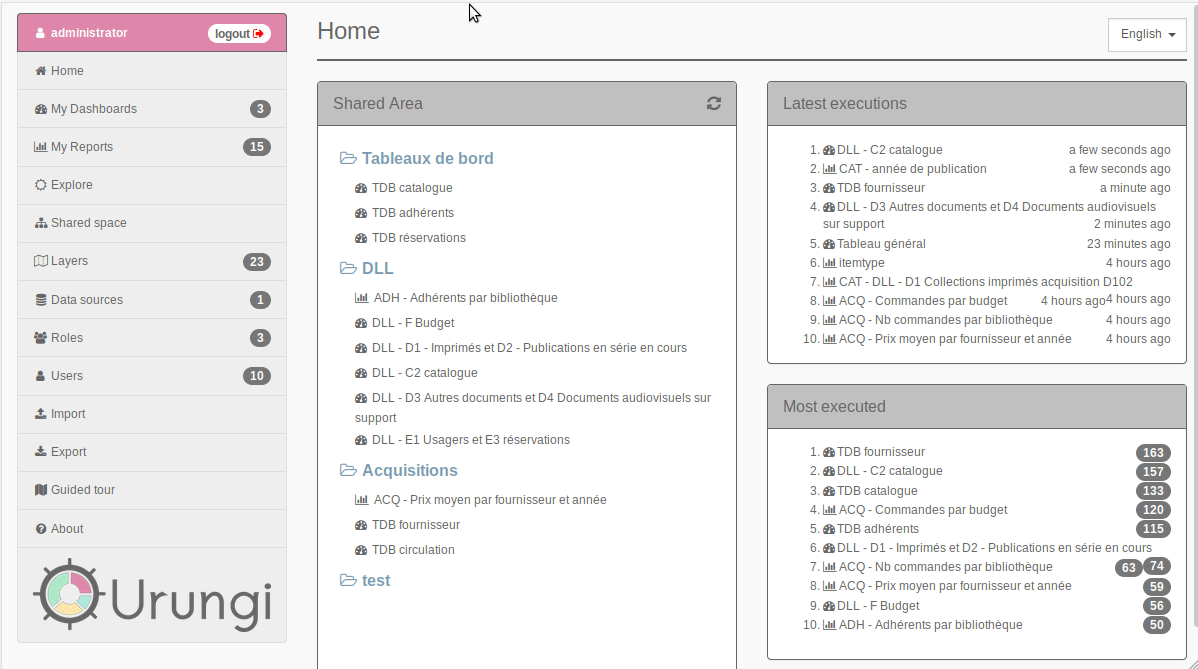
Urungi is a powerful tool for creating and managing statistics and dashboards. It allows you to connect to various SQL data sources, centralize your data, and analyze and explore it through custom views and reports, enabling you to gain valuable insights and make informed decisions.
Hmza Abbas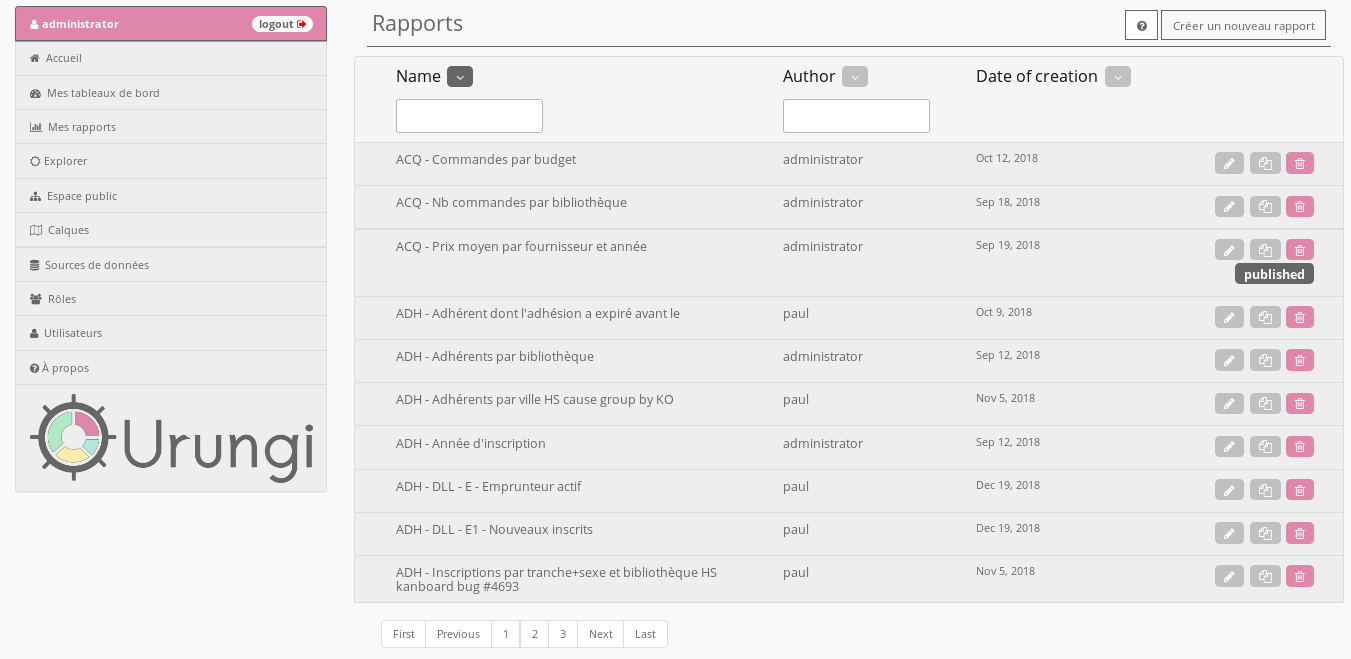
12- CBoard
CBoard is a versatile analysis platform that allows users to design multi-dimensional reports with ease. It offers an intuitive interface for normal users and serves as a BI product development platform for developers. Users can analyze data and design reports through simple drag-and-drop operations, while developers can extend data sources through Java program connections.
Hmza Abbas
13- Kuwala
Kuwala is a data workspace that enables collaboration between BI analysts and engineers for building analytics workflows. It integrates data engineering tools like Airbyte, dbt, and Prefect into a user-friendly interface. Key features include running on data warehouses, adding transformations and models with dbt, a node-based editor, and models-as-a-block for advanced analytics without coding. Supported databases include Postgres, BigQuery, and Snowflake.
Hmza Abbas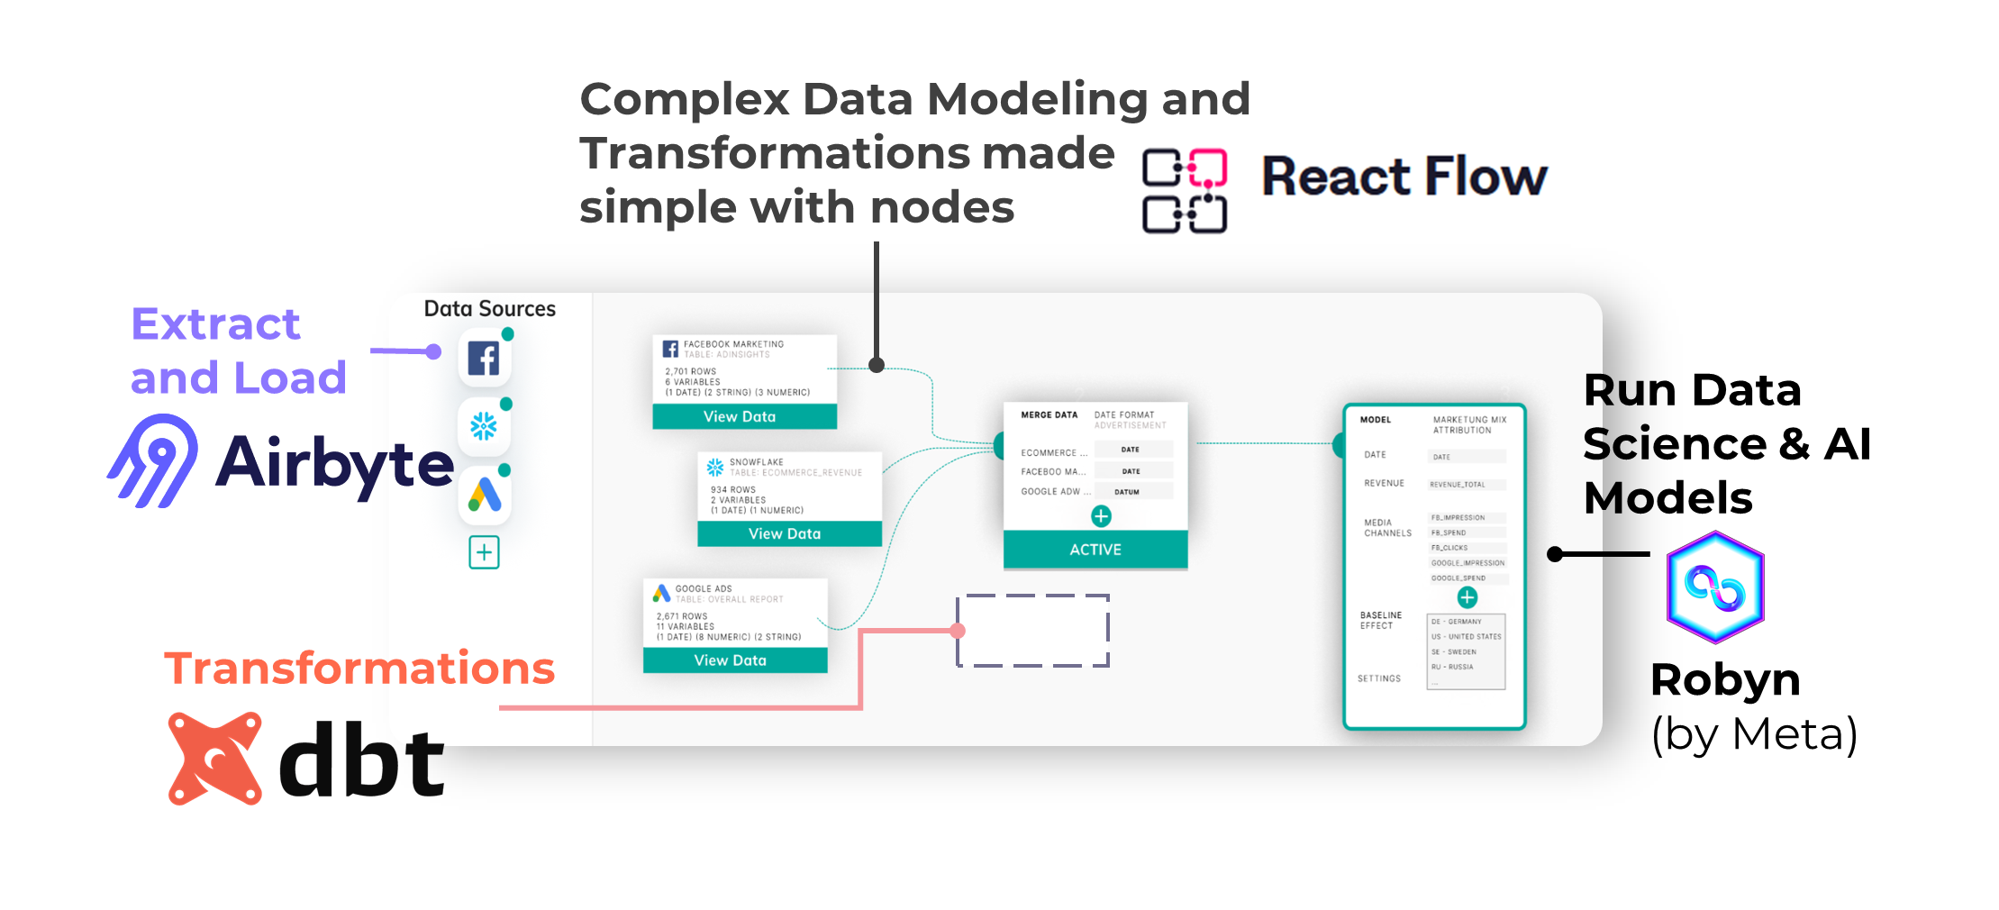
14- Panel
Panel is an open-source Python library that allows you to easily build powerful tools, dashboards, and applications entirely in Python. It provides high-level reactive APIs and works well with popular visualization tools like Altair, Bokeh, Matplotlib, Plotly, and more. Panel enables the combination of widgets, plots, tables, and other viewable Python objects into custom analysis tools and dashboards with bidirectional communication capabilities.
Hmza Abbas
15- Lightdash
Lightdash is an open-source business intelligence (BI) dashboard that revolutionizes the way users interact with their data. With Lightdash, users can effortlessly and efficiently visualize and analyze their data, unlocking valuable insights that drive informed decision-making.
Whether you are a small startup or a large enterprise, Lightdash is the perfect tool to empower your business with data-driven strategies. Experience the power of Lightdash and transform the way you explore and understand your data with its user-friendly and intuitive interface.
Features
- Connect to a wide range of data sources, such as databases, spreadsheets, and various cloud-based services, allowing you to access the information you need from multiple platforms.
- Utilize a powerful and intuitive interface to effortlessly create custom dashboards that are tailored to your specific needs, complete with interactive charts, tables, and other visually appealing visualizations.
- Dive deep into your data by applying filters and drilling down into the details, enabling you to uncover valuable insights and identify important trends that can drive informed decision-making.
- Easily share your data and insights with others by exporting them in popular formats like CSV, Excel, or JSON, making collaboration and sharing seamless and efficient.
- Collaborate effectively with your team members or external stakeholders by granting them access to your data and dashboards, ensuring everyone is on the same page and working towards a common goal.
- Customize the appearance of your dashboards to match your brand identity or personal style, creating a visually cohesive and professional look that reflects your unique identity.
- Empower your users with a user-friendly interface that allows them to effortlessly navigate and explore the data on their own, promoting self-service and reducing reliance on technical support.

 Hmza Abbas
16- Helical Insight CE
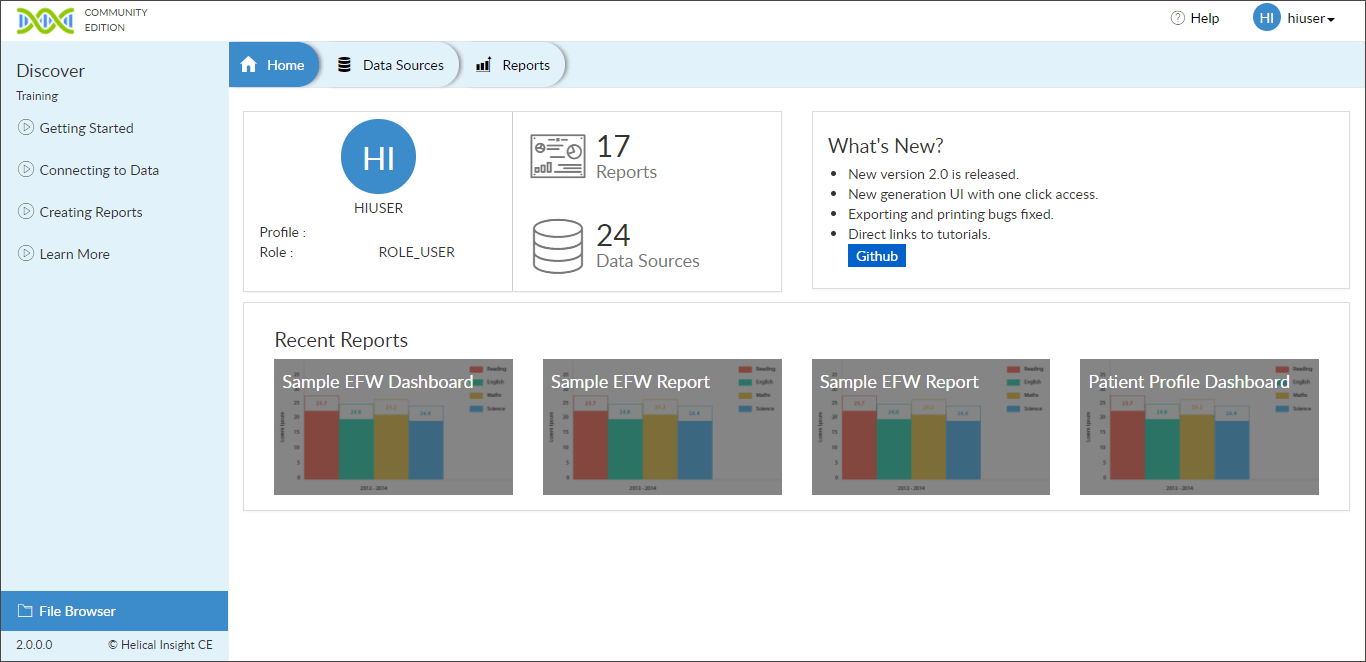
Helical Insight CE is an open-source business intelligence (BI) platform that provides powerful data visualization and reporting capabilities. It allows users to connect to various data sources, analyze data, and create interactive dashboards and reports.
Some of the key features of Helical Insight CE include:
- Data Connectivity: Helical Insight CE supports connectivity to a wide range of data sources, including databases, flat files, web services, and APIs. This allows users to access and analyze data from multiple sources in a unified environment.
- Drag-and-Drop Interface: The platform offers a user-friendly drag-and-drop interface for designing and customizing dashboards and reports. Users can easily add charts, tables, filters, and other visual components to create visually appealing and interactive visualizations.
- Ad-Hoc Reporting: Helical Insight CE enables users to perform ad-hoc reporting by allowing them to create custom reports on the fly. Users can apply filters, perform calculations, and customize the layout to generate dynamic and meaningful reports.
- Advanced Visualizations: The platform offers a wide range of visualization options, including charts, graphs, maps, and tables. Users can choose from various chart types, customize colors and styles, and create interactive dashboards that provide actionable insights.
- Data Security: Helical Insight CE provides robust data security features, including role-based access control, data encryption, and data masking. This ensures that sensitive data is protected and only accessible to authorized users.
- Collaboration and Sharing: Users can collaborate and share insights with team members by sharing dashboards and reports. Helical Insight CE allows for easy sharing via email, secure links, or embedding visualizations into other applications.
- Scheduled Reports: The platform supports scheduled report generation, allowing users to automate the delivery of reports at specified intervals. This ensures that stakeholders receive up-to-date information without manual intervention.
- Dynamic Drill-Downs: Helical Insight CE enables users to drill down into data to explore further details and uncover hidden patterns. Users can navigate through different levels of data hierarchies and gain deeper insights into the underlying datasets.
Hmza Abbas Hmza Abbas
17- Databazel (MongoDB)
Databazel provides native connectivity to MongoDB and offers a visual dashboard reporting interface for real-time analytics without the need for additional development or ETL. The solution is web-based, making it easily accessible through a web browser.
apiko-dev18- Grafana
Grafana is an open-source analytics and visualization platform that specializes in real-time monitoring, metric analysis, and interactive dashboards. It is widely used in the field of Business Intelligence (BI) for data visualization and monitoring purposes.
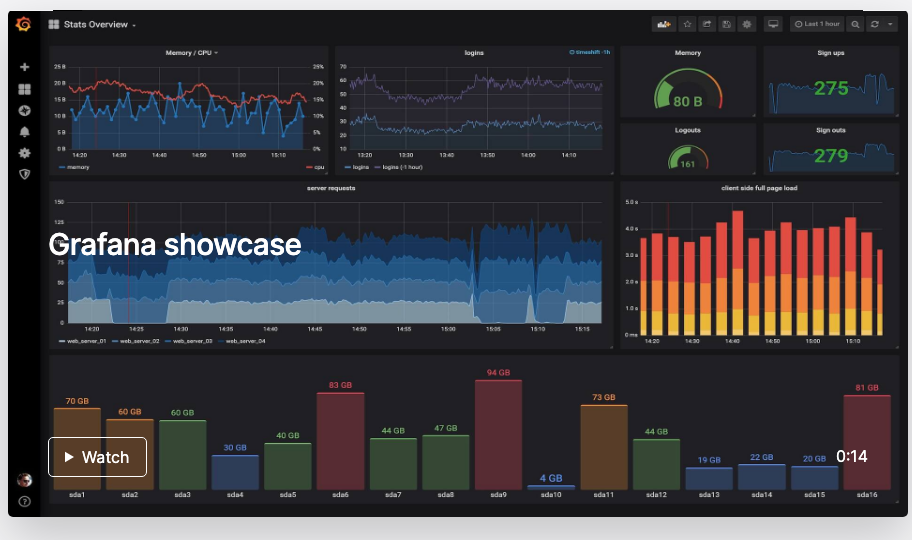
The role of Grafana in BI is to provide a flexible and customizable platform for creating visually appealing and interactive dashboards. It allows users to connect to various data sources, including databases, cloud services, and APIs, and visualize the data in the form of charts, graphs, tables, and other visual elements. Grafana supports a wide range of visualization options and offers advanced features like dynamic filtering, drill-down capabilities, and alerting.
Some of the use cases of Grafana in BI include:
- Real-time monitoring: Grafana allows users to create real-time dashboards that display live data from multiple sources. This is particularly useful for monitoring key performance indicators (KPIs), system metrics, and operational data in industries like IT, finance, and manufacturing.
- Data exploration and analysis: Grafana provides powerful querying capabilities that enable users to explore and analyze data from different perspectives. Users can apply filters, perform aggregations, and create complex visualizations to gain insights into their data.
- Performance tracking: Grafana offers features like time-series analysis and anomaly detection, which are valuable for tracking and analyzing performance metrics. Users can set up alerts and notifications based on predefined thresholds to proactively identify performance issues and take appropriate actions.
- IoT and sensor data visualization: Grafana integrates seamlessly with IoT platforms and time-series databases, making it an excellent tool for visualizing sensor data and IoT metrics. Users can create dashboards that display real-time data from sensors, analyze trends, and monitor anomalies.
- Business reporting and decision-making: Grafana allows users to create customized reports and executive dashboards that provide insights into business performance, customer behavior, and market trends. These visualizations help in making data-driven decisions and communicating key insights to stakeholders.
grafana19- Redash (Write)
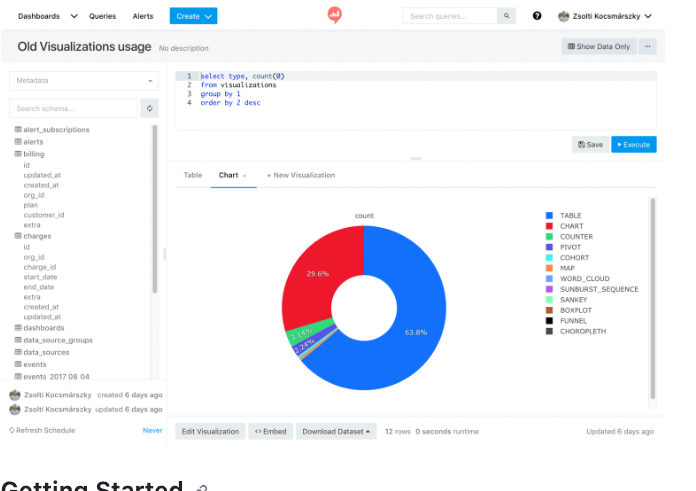
Redash is specifically designed to empower individuals, regardless of their technical expertise, to fully utilize the potential of both large and small datasets. SQL users rely on Redash to effortlessly explore, query, visualize, and collaborate on data from various sources. The outcomes of their efforts then enable all members within their organization to leverage the available data. On a daily basis, Redash is utilized by countless users across numerous organizations worldwide, facilitating the development of valuable insights and facilitating data-backed decision-making.
Features
- Browser-based: Everything in your browser, with a shareable URL.
- Ease-of-use: Become immediately productive with data without the need to master complex software.
- Query editor: Quickly compose SQL and NoSQL queries with a schema browser and auto-complete.
- Visualization and dashboards: Create beautiful visualizations with drag and drop, and combine them into a single dashboard.
- Sharing: Collaborate easily by sharing visualizations and their associated queries, enabling peer review of reports and queries.
- Schedule refreshes: Automatically update your charts and dashboards at regular intervals you define.
- Alerts: Define conditions and be alerted instantly when your data changes.
- REST API: Everything that can be done in the UI is also available through REST API.
- Broad support for data sources: Extensible data source API with native support for a long list of common databases and platforms.
getredash20- dbt (R)
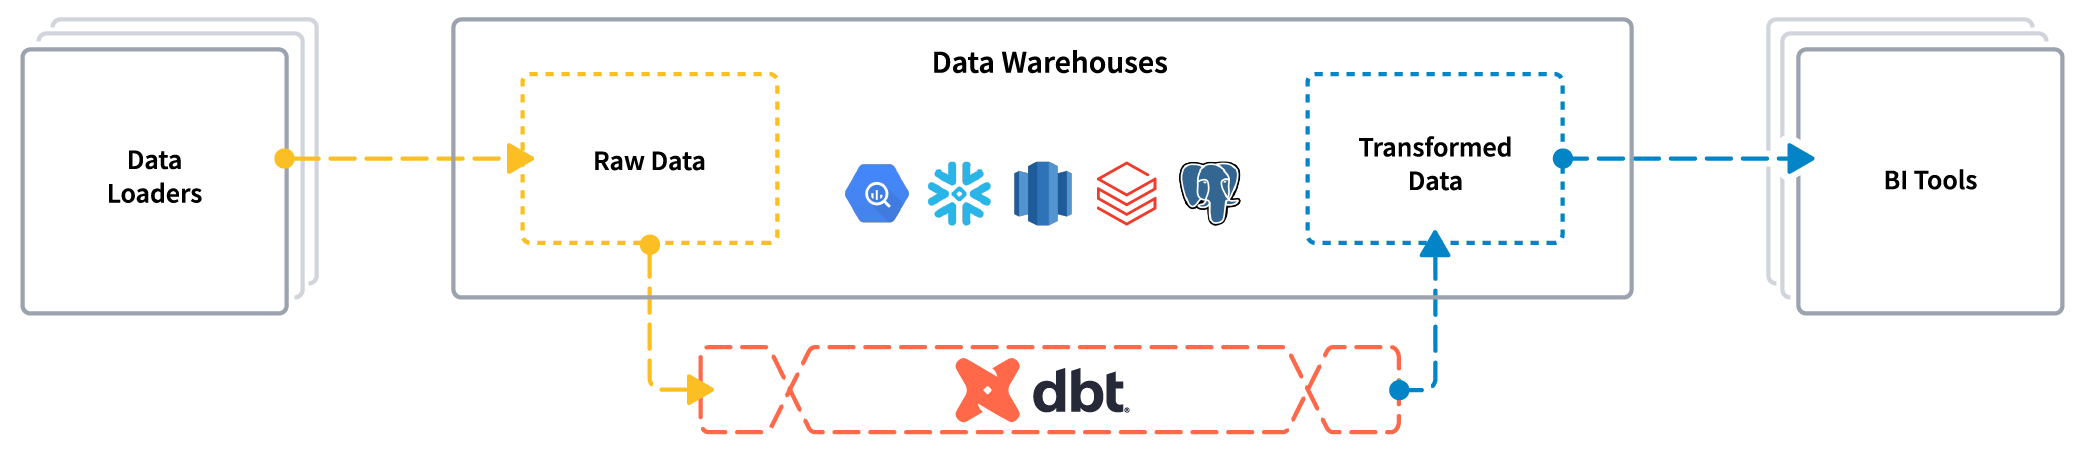
The dbt is an open-source tool that enables data analysts and engineers to transform their data using the same practices that software engineers use to build applications.
dbt-labs21- Openblocks (C)
Openblocks is an open-source platform that provides database visualization panels for exploring and analyzing data stored in databases. Some of the features of Openblocks for business intelligence (BI) include:
- Data exploration: Openblocks allows users to explore and interact with large datasets, perform ad-hoc queries, and apply filters to uncover insights and patterns in the data.
- Interactive visualizations: Users can create interactive charts, graphs, and dashboards to visualize database data. These visualizations can be customized and updated in real-time as the underlying data changes, providing a dynamic and interactive data exploration experience.
- Data aggregation and summarization: Openblocks offers various aggregation and summarization functions to summarize and present data in a concise and meaningful way. Users can generate reports, summaries, and key performance indicators (KPIs) based on the database data to gain valuable insights.
- BI integration: Openblocks seamlessly integrates with business intelligence (BI) tools, allowing users to leverage advanced analytics capabilities, such as advanced data modeling, predictive analytics, and data storytelling. This integration enhances the overall analytical capabilities of Openblocks.
With its user-friendly interface and powerful features, Openblocks enables users to gain a deeper understanding of their data, make informed decisions, and collaborate effectively within teams. It provides a comprehensive solution for database visualization and analysis in the context of business intelligence.
openblocks-dev22- Blazer (Recommended)
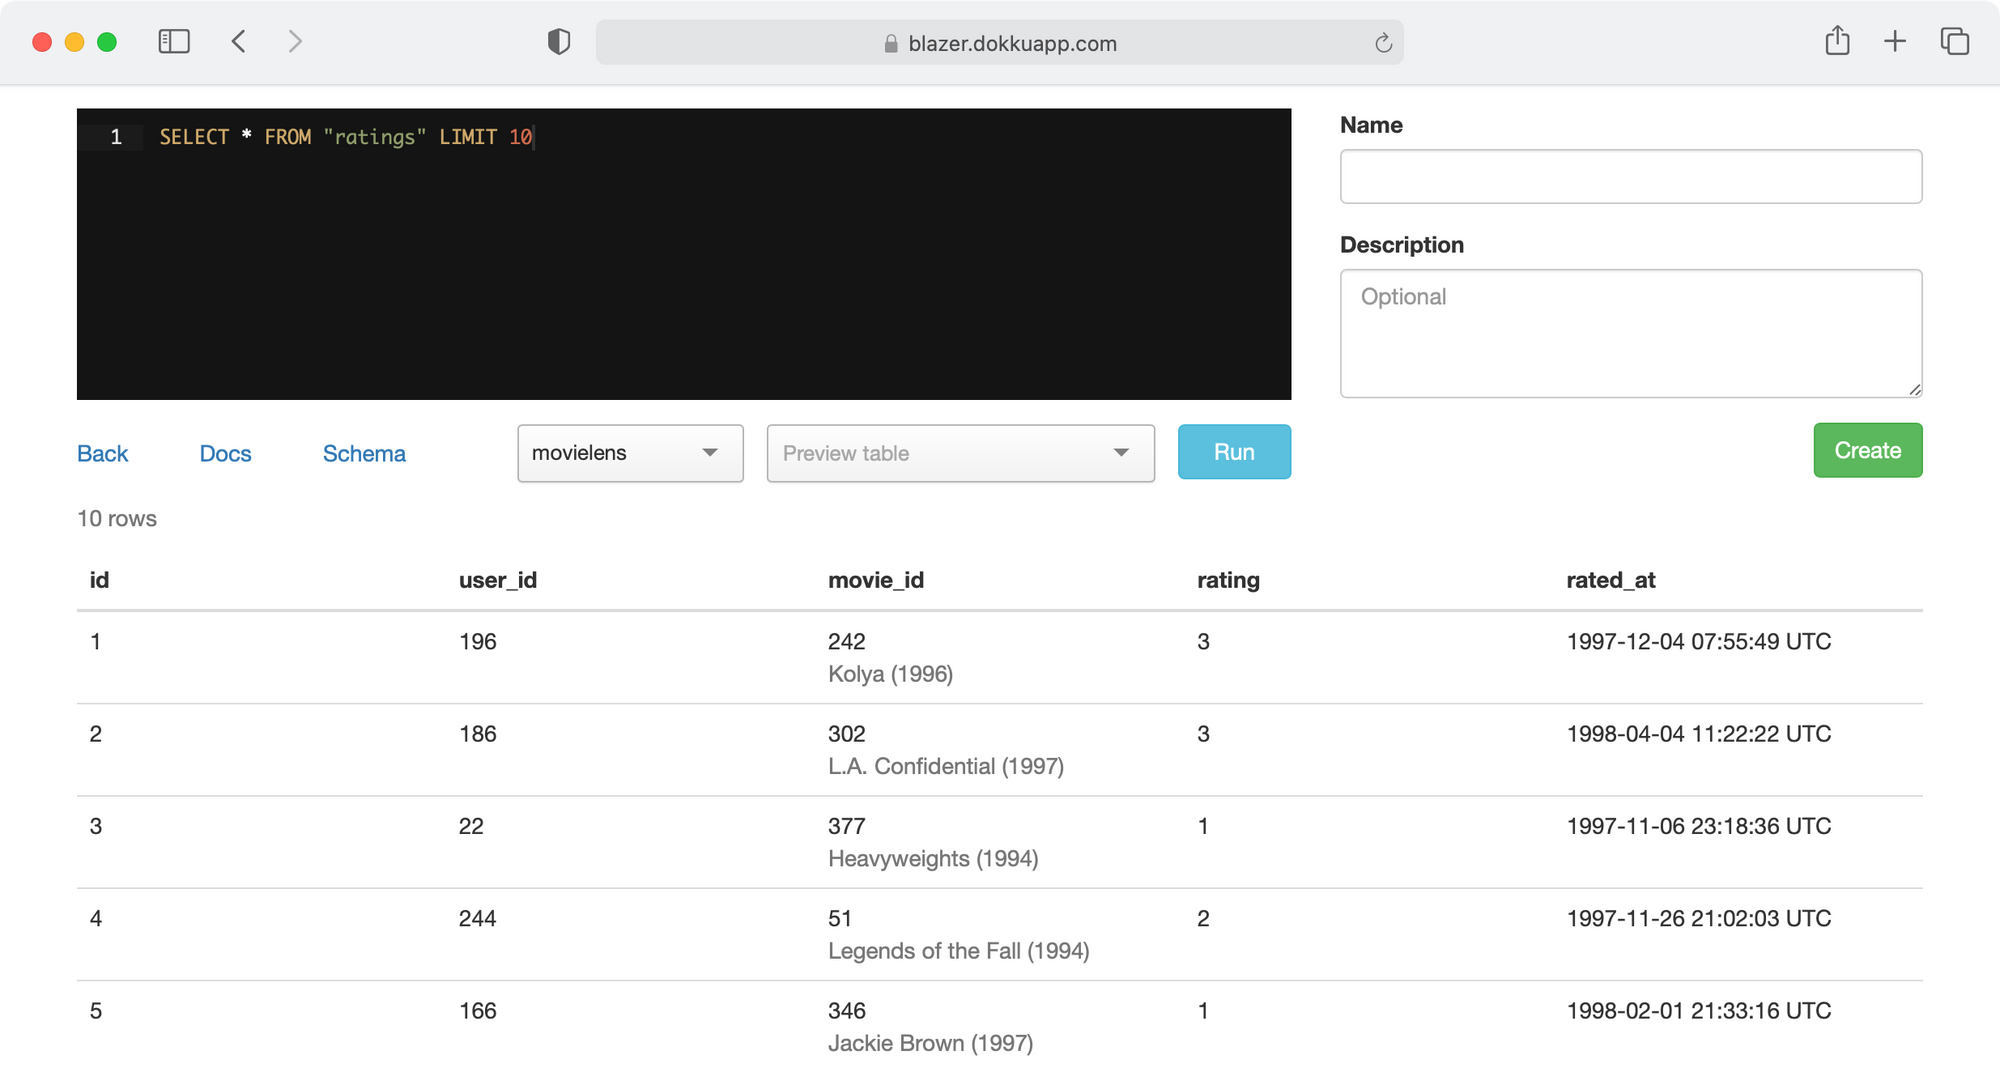
Blazer is a powerful tool that allows you to easily explore your data using SQL. With Blazer, you can effortlessly create a wide variety of charts and dashboards to gain valuable insights from your data, and you can easily share these visualizations with your entire team, enabling effective collaboration.
Some of the key features of Blazer include:
- Support for Multiple Data Sources - Blazer is compatible with popular databases like PostgreSQL, MySQL, Redshift, and many more. This means that no matter where your data is stored, you can seamlessly connect Blazer to your preferred data source and start analyzing your data.
- Enhanced Flexibility with Variables - Blazer allows you to run the same queries with different values by leveraging variables. This feature enables you to easily compare and contrast different scenarios or subsets of your data, providing you with a more holistic understanding of your data.
- Checks & Alerts for Data Quality - Blazer goes beyond just data exploration. It also allows you to set up checks and alerts to monitor the quality of your data. If any anomalies or issues are detected, Blazer can automatically send you email notifications, ensuring that you are always aware of any potential problems.
- Comprehensive Query Audits - Blazer keeps track of all the queries you run, providing you with a detailed audit trail. This audit functionality is invaluable when it comes to troubleshooting, performance optimization, and maintaining data integrity.
- Seamless Integration with Security Systems - Blazer seamlessly integrates with your existing authentication and security systems. This means that you can leverage your organization's security measures to control access to Blazer, ensuring that your data remains secure and only accessible to authorized individuals.
With its extensive range of features, Blazer is a versatile and user-friendly tool that empowers you to make data-driven decisions by efficiently exploring, visualizing, and analyzing your data.
ankane