Netdata collects metrics per second and presents them in beautiful low-latency dashboards.
It is designed to run on all of your physical and virtual servers, cloud deployments, Kubernetes clusters, and edge/IoT devices, to monitor your systems, containers, and applications.
What does it monitor?
| Component | Linux | FreeBSD | macOS | Windows* |
|---|---|---|---|---|
| System Resources CPU, Memory and system shared resources |
Full | Yes | Yes | Yes |
| Storage Disks, Mount points, Filesystems, RAID arrays |
Full | Basic | Basic | Basic |
| Network Network Interfaces, Protocols, Firewall, etc |
Full | Basic | Basic | Basic |
| Hardware & Sensors | Full | Some | Some | Some |
| O/S Services Resources, Performance and Status |
Yessystemd-only |
- | - | - |
| Logs | Yessystemd-journal |
- | - | - |
| Processes Resources, Performance, OOM, and more |
Yes | Yes | Yes | Yes |
| Network Connections Live TCP and UDP sockets per PID |
Yes | - | - | - |
| Containers Docker/containerd, LXC/LXD, Kubernetes, etc |
Yes | - | - | - |
| VMs (from the host) KVM, qemu, libvirt, Proxmox, etc |
Yescgroups |
- | - | YesHyper-V |
| Synthetic Checks Test APIs, TCP ports, Ping, Certificates, etc |
Yes | Yes | Yes | Yes |
| Packaged Applications nginx, apache, postgres, redis, and hundreds more |
Yes | Yes | Yes | Yes |
| Custom Applications OpenMetrics, StatsD |
Yes | Yes | Yes | Yes |
Features
💥 Collects data from 800+ integrations
Operating system metrics, container metrics, virtual machines, hardware sensors, applications metrics, OpenMetrics exporters, StatsD, and logs.
💪 Real-Time, Low-Latency, High-Resolution
All data are collected per second and are on the dashboard immediately after data collection.
😶🌫️ Unsupervised Anomaly Detection
Trains multiple Machine-Learning (ML) models for each metric and uses AI to detect anomalies based on the past behavior of each metric.
🔥 Powerful Visualization
Clear and precise visualization allowing you to understand any dataset at first sight, but also to filter, slice and dice the data directly on the dashboard, without the need to learn a query language.
🔔 Out of box Alerts
Comes with hundreds of alerts out of the box to detect common issues and pitfalls, revealing issues that can easily go unnoticed. It supports several notification methods to let you know when your attention is needed.
😎 Low Maintenance
Fully automated in every aspect: automated dashboards, out-of-the-box alerts, auto-detection and auto-discovery of metrics, zero-touch machine-learning, easy scalability and high availability, and CI/CD friendly.
⭐ Open and Extensible
Netdata is a modular platform that can be extended in all possible ways and it also integrates nicely with other monitoring solutions.
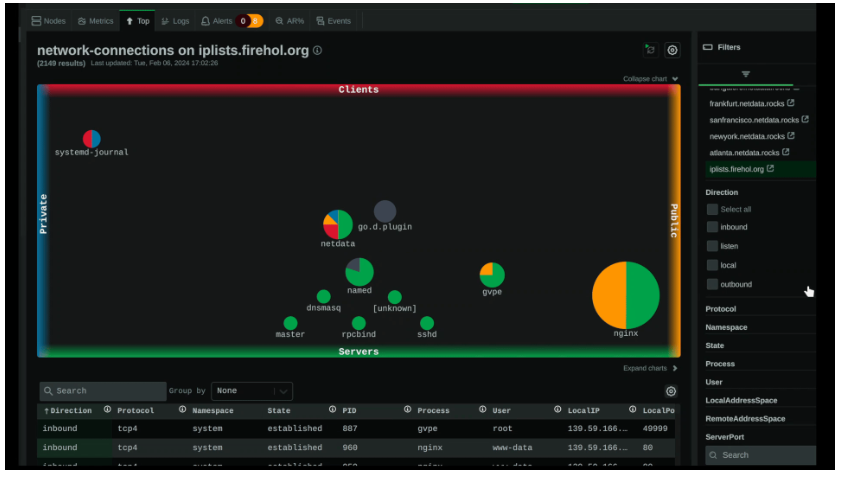
New Feature: Network Connections Explorer
Network Connections viewer is currently in the nightly builds of Netdata!
This tool visualizes all the sockets each server has (IPv4 and IPv6, TCP and UDP). It can classify them as inbound, outbound, listen and local and allow filtering on them.
The visualization has 4 sides:
public(ie. public IPs),private(ie. private and reserved IPs),servers(ie. listening and inbound sockets),clients(ie. sockets towards other servers).
The position of each application on the chart is determined by the classification of the sockets it has. To the top are clients, to the bottom are servers, to the right are internet facing applications, to the left is internal network applications.
The size of each application in the chart is determined by the number of sockets it has, and each application is a pie chart representing the percentage of each kind of sockets it has.
Supported Platforms
- Windows
- Linux: Ubuntu, Debian CentOS, Fedora, Suse, Red Hat, Arch, Alpine, Gentoo, even BusyBox.
- Docker
- macOS
- FreeBSD
License
Netdata is released under GPLv3+. Netdata re-distributes other open-source tools and libraries.
The Latest Netdata UI, is distributed under NCUL1. It also uses third party open source components.
Resources & Downloads
 netdata